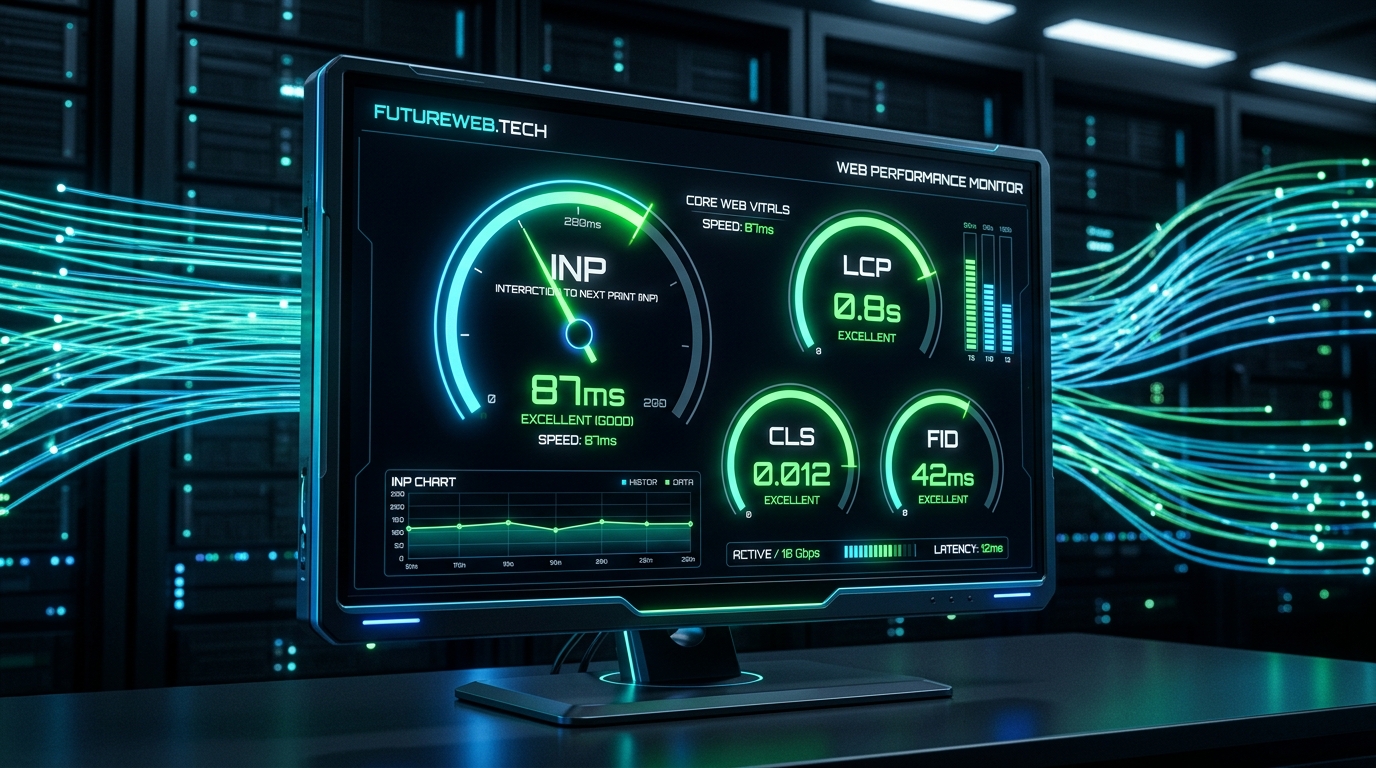
Discovering how to fix interaction to next paint inp has become the highest priority optimization for web engineering teams striving for Core Web Vitals excellence in 2026. Ever since Google replaced First Input Delay (FID) with Interaction to Next Paint (INP) as a definitive Core Web Vitals ranking factor, websites with sluggish user interfaces have suffered algorithmic ranking declines. Unlike its predecessor, INP monitors every user interaction throughout the entire session lifecycle.
To reliably fix interaction to next paint inp and maintain responsive interaction latency below the 100-millisecond threshold, developers must optimize the browser's main thread rendering budget. When long-running JavaScript execution, excessive DOM re-renders, or unthrottled event handlers block the main thread, user clicks and keystrokes stall noticeably. At Growth Lab Web Development, our performance engineers deploy cutting-edge profiling techniques to guarantee ultra-responsive web experiences.
⚡ Interaction to Next Paint (INP) Benchmarks
1. How to Fix Interaction to Next Paint INP in Production
To diagnose and resolve INP bottlenecks effectively, engineers must understand that total interaction latency is composed of three distinct chronological phases:
- Input Delay: The duration between the user initiating an action (tap, click, key press) and when the browser's main thread begins executing the corresponding event callback.
- Processing Time: The CPU time required to execute the synchronous JavaScript event handlers and state updates.
- Presentation Delay: The time required for the browser compositor to recalculate layout styles, paint updated pixels, and display the next graphical frame on the physical display.
For an authoritative breakdown of this browser metric, consult the official Web.dev Guide on Optimizing Interaction to Next Paint. In addition, explore our architectural analysis on Next.js 16 Server Components and Web Performance. Following these core principles allows engineering teams to systematically fix interaction to next paint inp across complex web apps.
| Root Bottleneck | Underlying Mechanism | Engineering Remediation | Expected Impact |
|---|---|---|---|
| Long JavaScript Tasks | Monolithic functions blocking main thread > 50ms | Yield to main thread with scheduler.yield() |
Drops input delay by 60% |
| Monolithic React Re-renders | State update triggers large virtual DOM reconciliations | Wrap expensive state in startTransition() |
Keeps typing input fluid |
| Third-Party Analytics Tags | Tag managers executing simultaneous tracking scripts | Offload tracking to Web Workers with Partytown | Frees 150ms+ CPU time |
| Forced Synchronous Layout | Reading geometric CSS properties immediately after writing | Batch DOM reads and writes via requestAnimationFrame | Eliminates presentation delay |
2. Breaking Up Long Tasks with scheduler.yield()
A primary culprit behind degraded INP is the presence of long tasks—JavaScript code executions that run uninterrupted for more than 50 milliseconds. When a long task runs, the browser is completely unable to respond to incoming user inputs, causing perceptible lag. Learning to yield control allows teams to fix interaction to next paint inp permanently.
Historically, developers used setTimeout(..., 0) to yield control back to the browser. However, modern browsers support the native scheduler.yield() API, which allows long computational loops to voluntarily yield the main thread to handle urgent user inputs before resuming execution without losing priority.
3. Profiling Long Animation Frames (LoAF) in Chrome DevTools
Modern Chromium browsers introduce the Long Animation Frames (LoAF) API, which provides vastly superior diagnostic granularity compared to legacy performance timelines. Whereas standard profiling only alerted developers that a generic task exceeded 50 milliseconds, LoAF pinpoints the exact script URL, character position, and invoker function responsible for rendering delays.
To profile LoAF effectively, open Chrome DevTools, navigate to the Performance panel, and check the 'Web Vitals' and 'Long Tasks' tracks. When an interaction stalls, inspect the associated animation frame. You will frequently find that complex recursive state updates or unthrottled resize listeners occupy 85% of the frame duration. Profiling with LoAF gives developers a surgical roadmap to fix interaction to next paint inp without refactoring unaffected code modules.
4. DOM Virtualization and CSS Containment for Heavy Layouts
Rendering complex web applications with thousands of simultaneous DOM nodes is a frequent driver of severe presentation delay. When a user clicks a filter toggle on an e-commerce catalog or search index with 2,000 items rendered in the DOM, the browser must recalculate styles and geometry across all 2,000 elements simultaneously before drawing the next frame.
To conquer this bottleneck, deploy windowing and virtualization libraries such as TanStack Virtual. Virtualization ensures that only the 15 to 20 DOM elements currently visible within the active viewport exist in memory, unmounting offscreen rows dynamically. Coupled with CSS content-visibility: auto and contain: layout paint, style recalculations remain strictly confined to the active container, allowing developers to fix interaction to next paint inp even on data-intensive enterprise dashboards.
5. Optimizing React Transitions & State Hydration
In React applications, updating application state often triggers massive component tree re-evaluations. For instance, filtering an interactive data table with hundreds of rows can freeze the search input while the list updates.
By utilizing React 19's useTransition() and startTransition() hooks, engineers can explicitly bifurcate updates into urgent and non-urgent categories. The immediate text input updates synchronously, providing instant visual feedback to the user, while the expensive table re-render is marked as a background transition that yields instantly if the user presses another key. Adopting concurrent transitions is a proven methodology to fix interaction to next paint inp on heavy client dashboards.
6. Offloading Third-Party Scripts to Web Workers
Marketing tags, heatmap trackers, and customer chat widgets frequently hijack the main thread during peak user interaction windows. While essential for business intelligence, loading these libraries directly in the primary execution context destroys Core Web Vitals scores.
Modern engineering teams deploy libraries like Partytown to run third-party tracking scripts inside dedicated Web Workers on background threads. This preserves full analytics fidelity while completely liberating the main thread for instant UI rendering. Discover our full suite of technical services across our Services Portfolio.
7. Real-World Field Telemetry & Synthetic Profiling
Synthetic lab tests conducted on high-powered developer laptops often fail to replicate real-world mobile INP degradation. Real users operate mid-tier mobile devices under constrained network conditions and battery-saving CPU throttling. Continuous profiling is required to fix interaction to next paint inp across all screen resolutions and browser platforms.
Therefore, engineering organizations must install the web-vitals JavaScript library to stream real user monitoring (RUM) data directly to analytics endpoints. This field telemetry uncovers precisely which interactive elements—such as mobile navigation toggles or checkout buttons—cause real-world latency spikes. Inspect our client execution stories in our published Engineering Case Studies.
8. Action Plan: 5 Steps to Fix Interaction to Next Paint INP Today
To achieve immediate, measurable improvements and successfully fix interaction to next paint inp across production applications, execute this step-by-step performance roadmap:
- Audit Main Thread Long Tasks: Run Chrome DevTools Performance profiles on low-end mobile device throttling to uncover any function exceeding 50ms of CPU execution time.
- Implement Yielding Loops: Refactor data iteration loops using
await scheduler.yield()to ensure UI typing and tapping events take immediate precedence. - Migrate Non-Critical Tracking: Shift third-party analytics, attribution scripts, and chat widgets into Web Workers using Partytown or Comlink.
- Adopt React 19 Concurrent Transitions: Wrap secondary component updates in
startTransitionboundaries to keep user input fields responsive. - Enforce Real-Time RUM Alerts: Configure telemetry alerts to notify your engineering team immediately if the 75th percentile mobile INP score exceeds 100ms.
Systematically applying this protocol ensures your team can fix interaction to next paint inp and maintain flawless Core Web Vitals rankings across all customer devices.
Achieve Sub-100ms INP Across Your Web App
Eliminate UI lag and dominate Core Web Vitals rankings with Growth Lab's dedicated frontend performance engineering services.